Every card is a problem
you would have found too late.
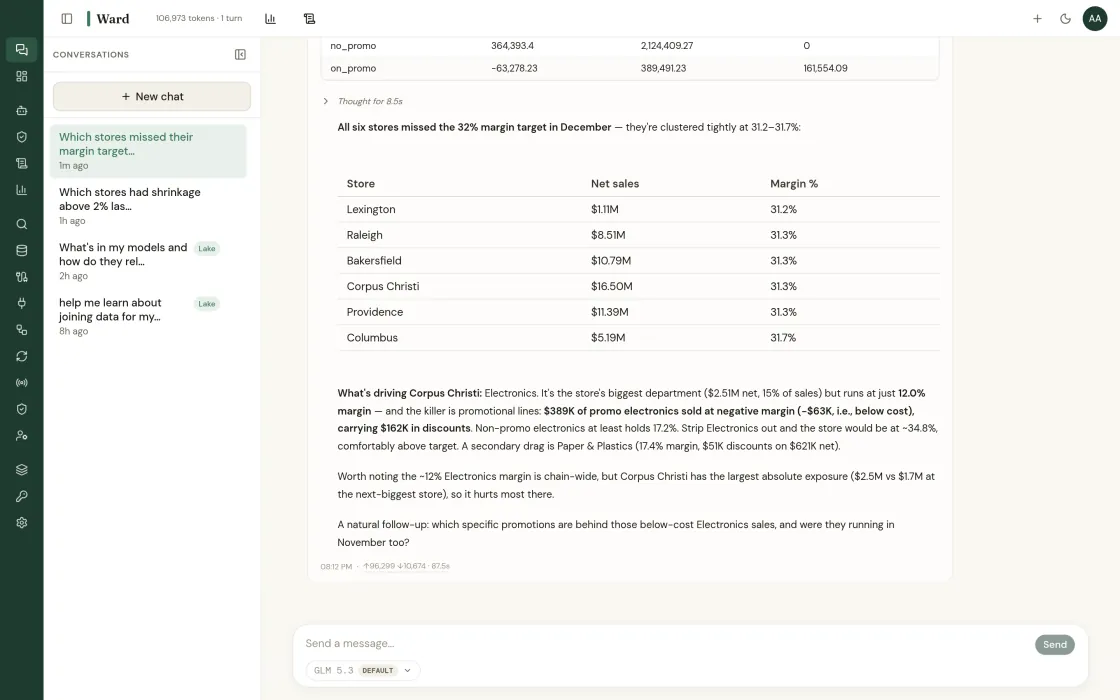
Margin erosion, promo conflicts, shrinkage spikes, staffing mismatches. Ward catches each one and explains what changed, why, and what to do next. Click any number to see the SQL.
What changed. Why. What to do next.
Dashboards show what happened, not why or what to do about it. Each insight card surfaces one anomaly, explains the root cause, quantifies the impact, and recommends a next step. They arrive automatically, no login required.
The math behind every number
Forecasts run on ARIMA, Holt-Winters, Bayesian hierarchical, and gradient-boosted residuals. Anomalies use z-score against a 90-day rolling baseline. Each card carries the model card, the MAPE, and the confidence interval. Click the number to see the SQL, source tables, and parameters.
The agents behind every card
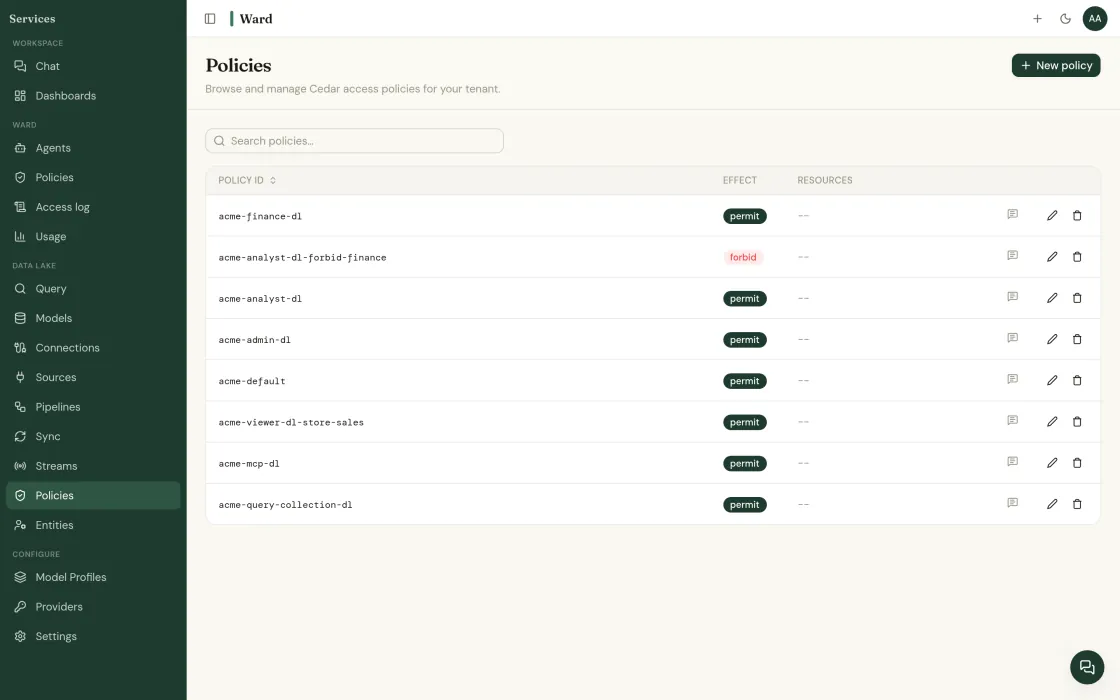
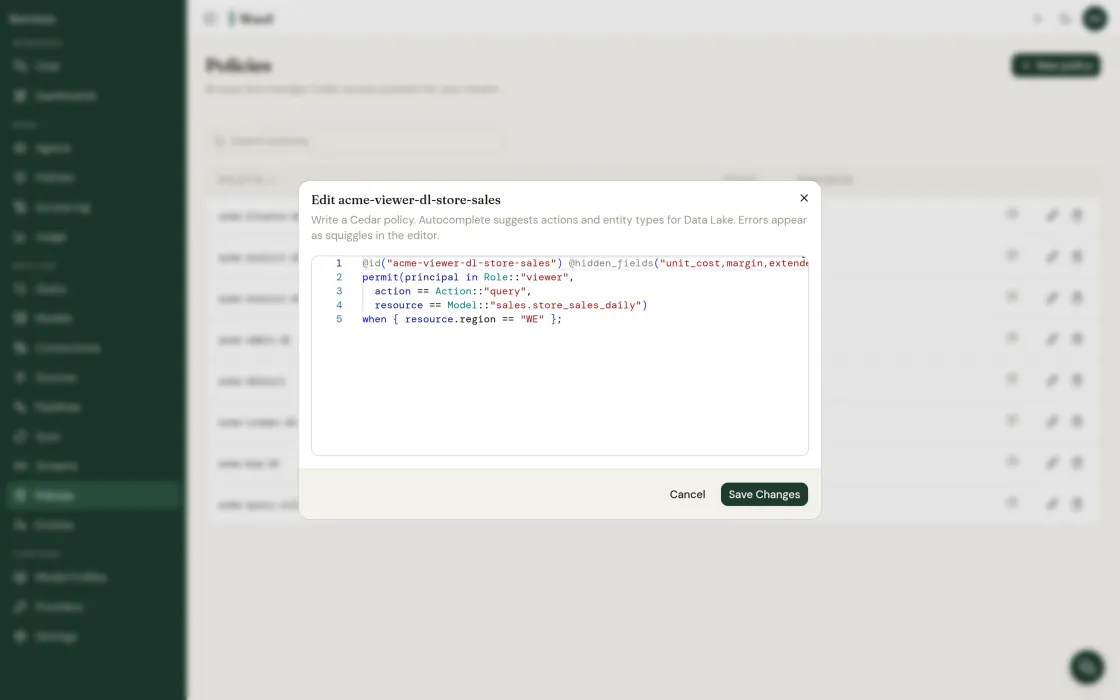
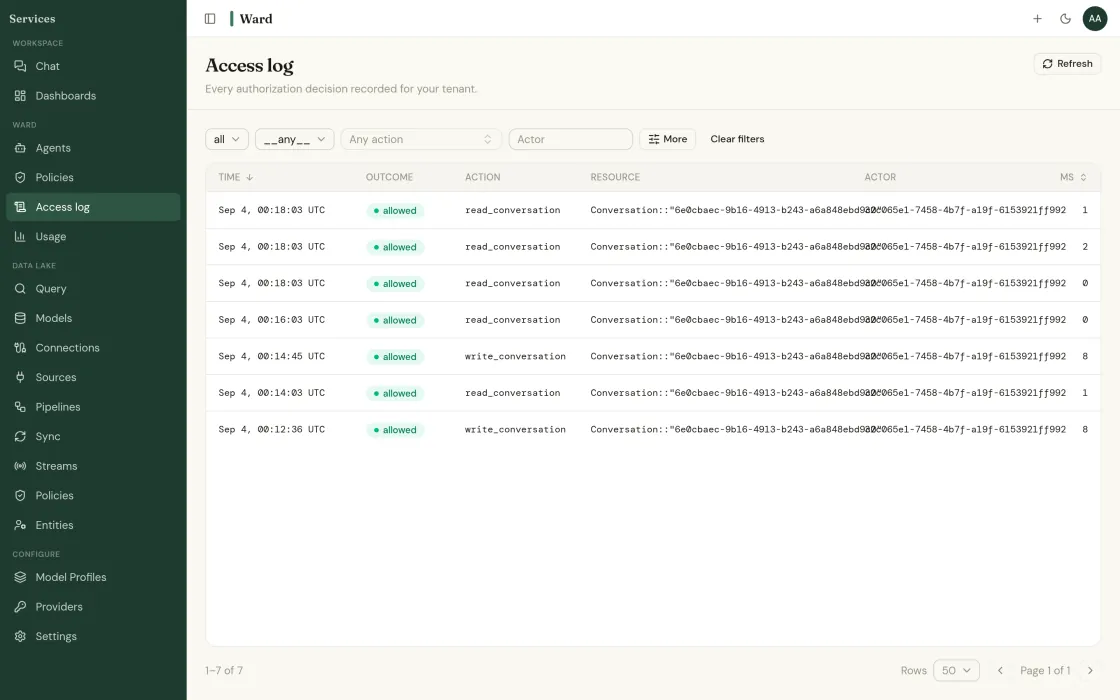
Define an agent for any job, each on a prebuilt, retail-specific playbook: shrink, store sales, supplier scoring, loss prevention, labor, store ops. Each runs under a written charter: scope, sources, allowed actions, owner, version. Diff two versions side by side. Every edit is logged with name, time, and approver.
Cards by insight type
Ward generates cards across eight core domains, each tuned to a specific operational signal.
Where Insight Cards
does the work.
The insight types that lean on insight cards to deliver value.
Built for the teams
that catch problems first.
The KPIs that change
when this runs.
Operator stories
and the alternatives.
Two ways to start.
Run a fixed-fee pilot on your data, or talk to advisory about a broader engagement.
Every card is a problem your team would have found too late.
See what Ward catches on your actual data.
Read-only to start · your LLM keys · SOC 2 Type II underway · or book a call directly
Find out what your data has been hiding.
Tell us about your operation. We’ll show you the problems Ward catches, and the ones your current tools miss.